The Measurement of Attitude
Chapter 3: The Scale-Values
L. L. Thurstone and E. J. Chave
Table of Contents | Next | Previous
GRAPHICAL DETERMINATION OF THE SCALE-VALUES
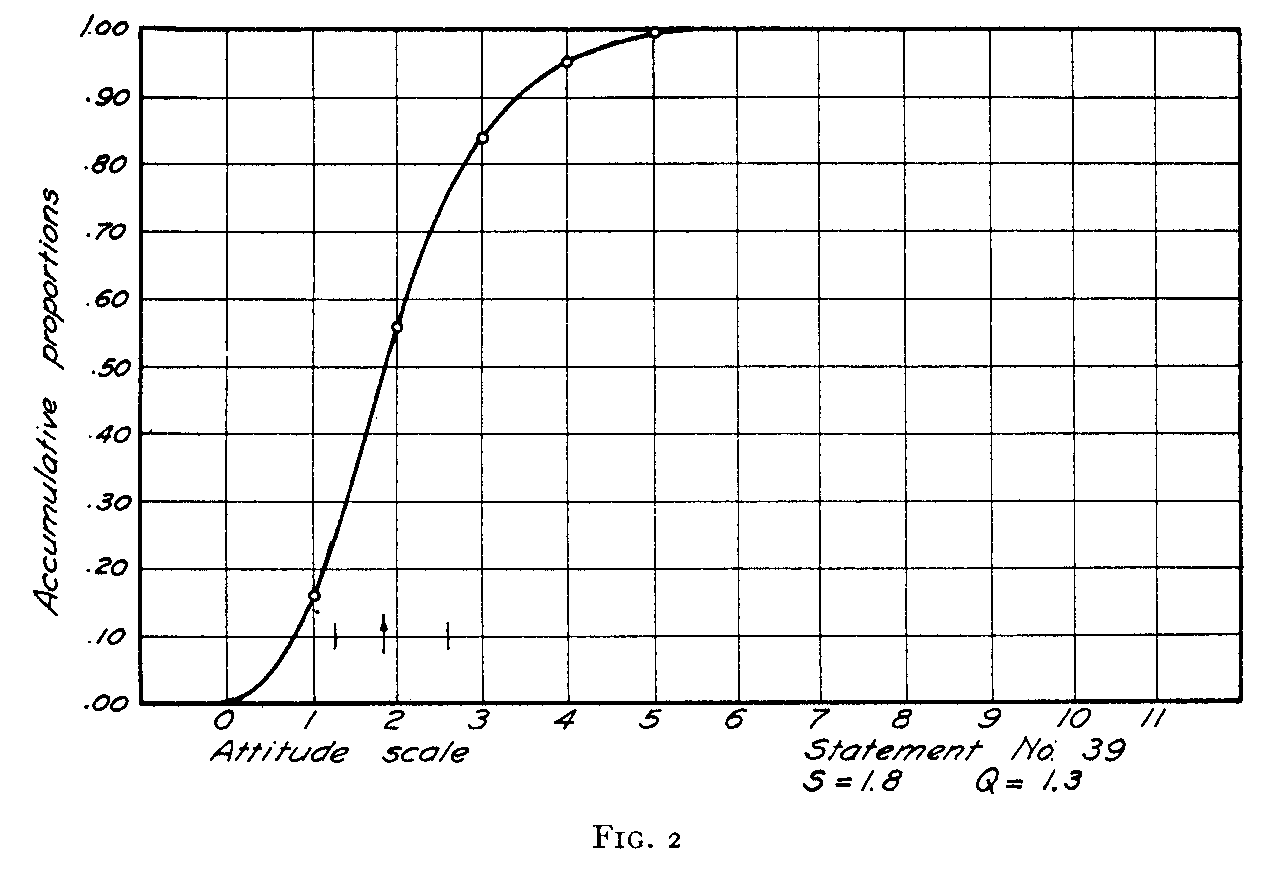
The scale-values were determined graphically. In order to illustrate this procedure seven of the graphs are here reproduced, and they show several different types of statement of opinion. In Figure 2 statement No. 39 is represented. This graph is plotted directly from the accumulative proportions of Table I. The graph shows immediately that practically all of the subjects classified this statement in the five class-intervals most favorable to the church. The statement reads as follows: "I believe the church is absolutely needed to overcome the tendency to individualism and selfishness. It practices the golden rule fairly well." The curve of Figure 2 crosses the 50 per cent level at the interpolated scale-value of 1.8 which is assigned as the scale-value for this statement. The scale-value is such that half of the readers classified this statement as more favorable to the church than the position 1.8, while half of them placed the statement as less favorable to the church than this position in the series of eleven piles.
The scale-value is indicated by a small vertical arrowhead. On either side of the arrowhead is a small vertical line. These two vertical lines indicate the two quartile points for the curve. In Figure 2 the two vertical marks are located at scale-values of 1.3 and 2.6, respectively. The separation between these two marks is a measure of the ambiguity of the statement. In the present case the ambiguity, the Q-value, is 1.3, which is simply the difference between 2.6 and 1.3. If a statement is very ambiguous, the different readers will place it over a wide range on the scale and the Q-value will be correspondingly high. If the statement is interpreted with regard to the specified attitude variable rather con-
( 37) -sistently, if the statement is concise and uniform in the meaning which it conveys to all the readers, then they will place it at approximately the same position on the scale, and the Q-value will then be correspondingly small.
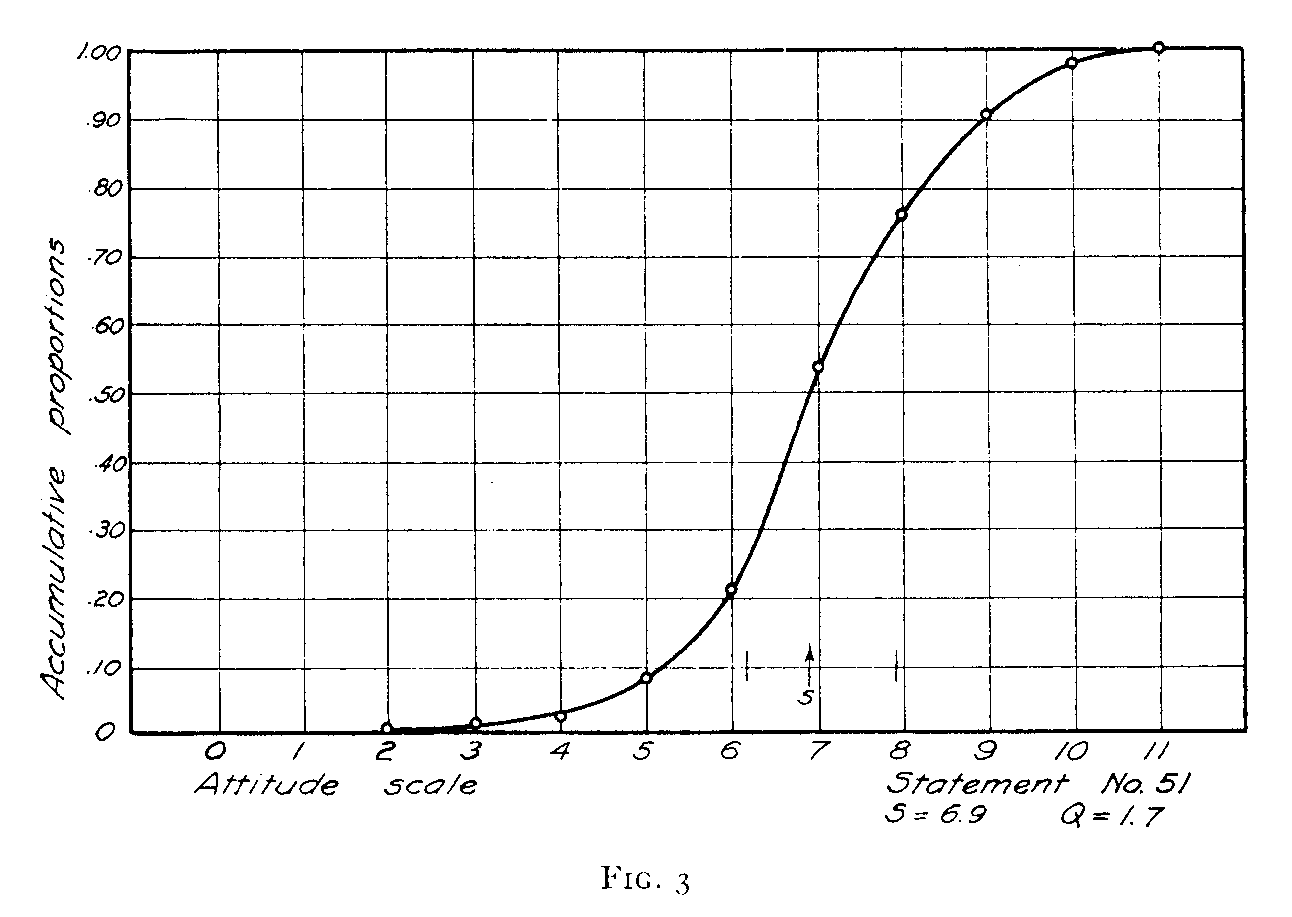
In Figure 3 a similar graph is drawn for statement No. 51, which reads: "I feel I can worship God better out of doors than in
the church and I get more inspiration there." This statement is clearly toward the other end of the scale and its scale-value is 6.9. The ambiguity, or Q-value, is 1.7.
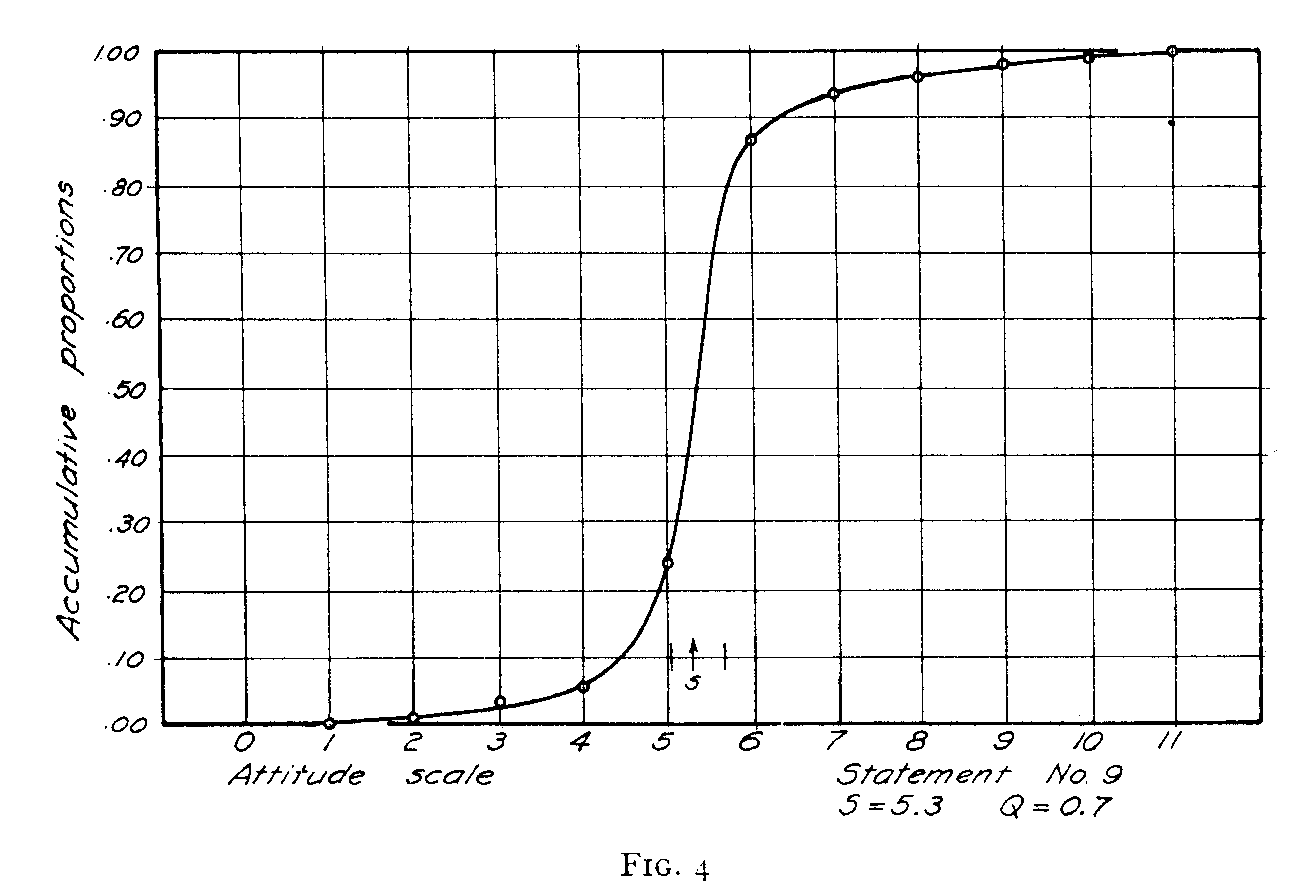
Figure 4 has been included to show the psychometric graph for statement No. 9, which is judged rather uniformly. It has a low ambiguity. Its Q-value is only 0.7 with a scale value of 5.3. It is a neutral statement which is judged to be neutral by the great majority of the readers. The statement is, "I don't believe church-going will do anyone any harm." In contrast with this statement is No. 8 which is a very ambiguous one. It reads: "I believe the church has a good influence on the lower and uneducated classes
( 38)
( 39) but has no value for the upper, educated classes." This statement is represented in Figure 5, according to which the scale value is 6.7 and the ambiguity or Q-value is 3.6. Note that the statement spreads in a more or less rectangular distribution over eight class-intervals. This is a double-barreled statement, and it has been found that such statements turn out more frequently than not to be ambiguous. Such a statement is eliminated from the final scale
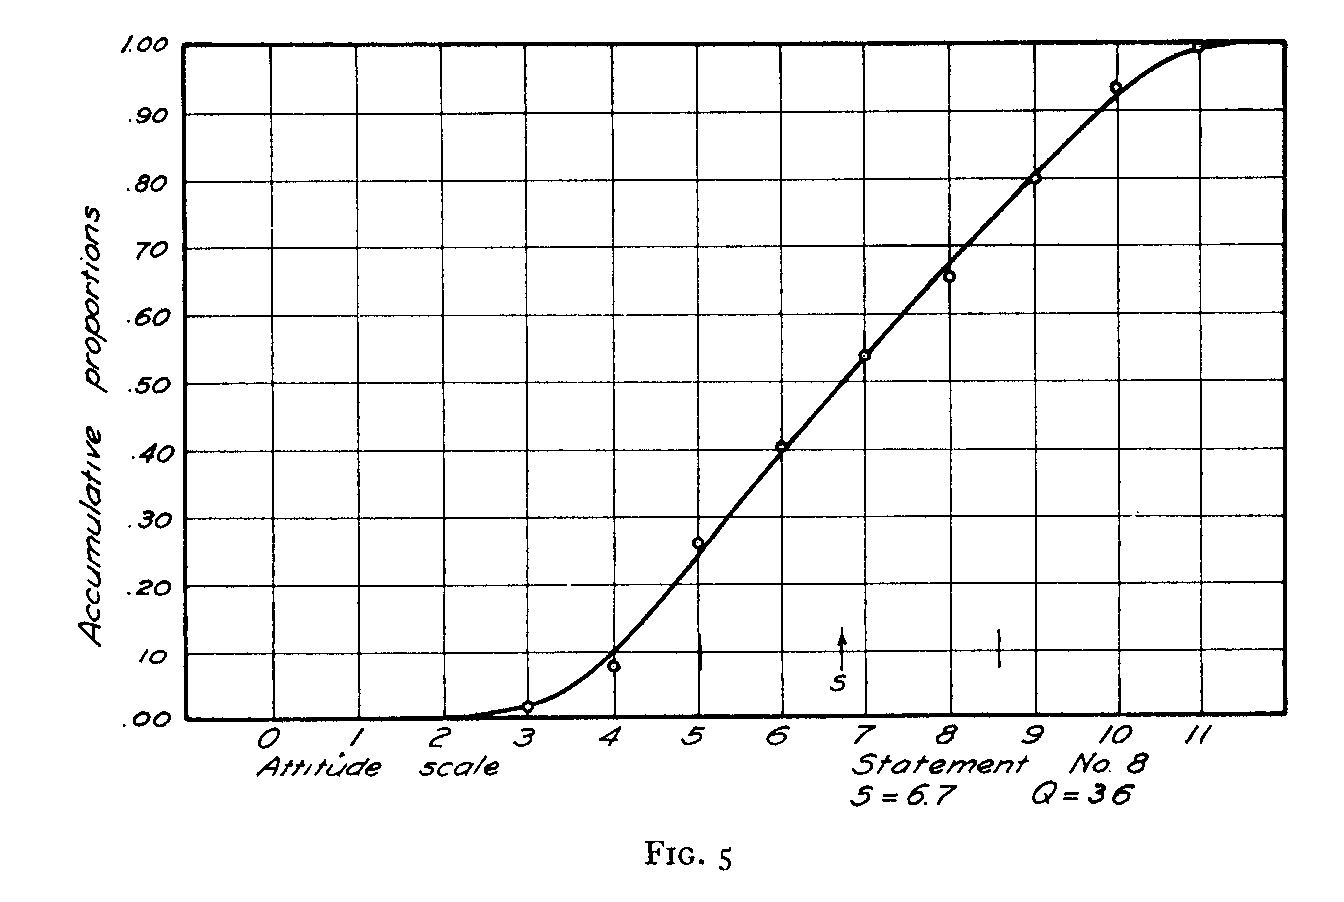
on account of the objective measure of ambiguity which is given directly in the Q-value.
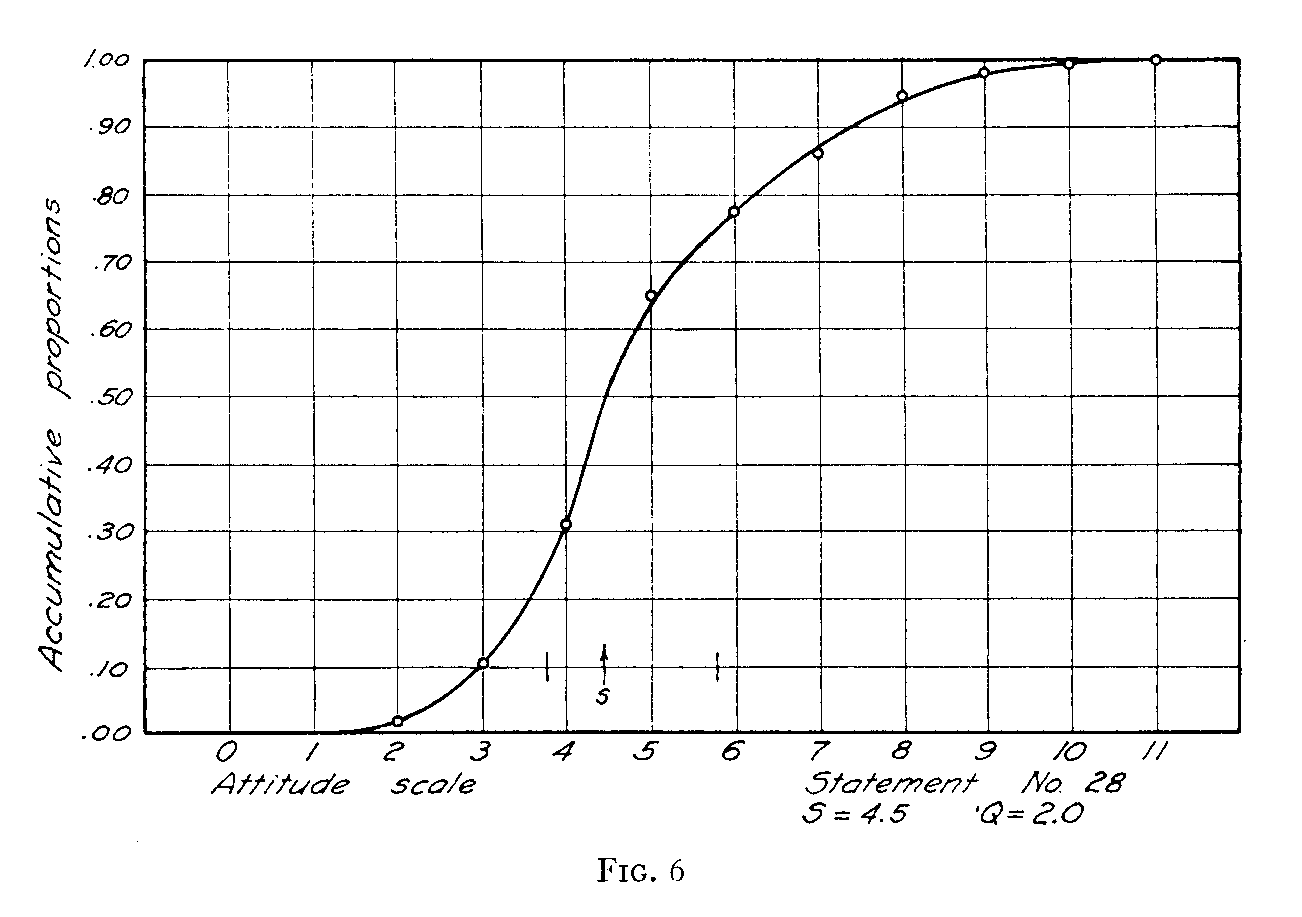
Figure 6 represents statement No. 28 and is included to show the appearance of the psychometric graph when it is continuous but skewed.
In Figure 7 we have a psychometric graph for statement No. 113 which more than half of the readers placed in the first of the eleven piles. Its scale-value can be obtained by extrapolation as shown in the graph whereby the scale-value is located slightly be-low the value of 1.00. In order to estimate the Q-value, the upper
( 40)
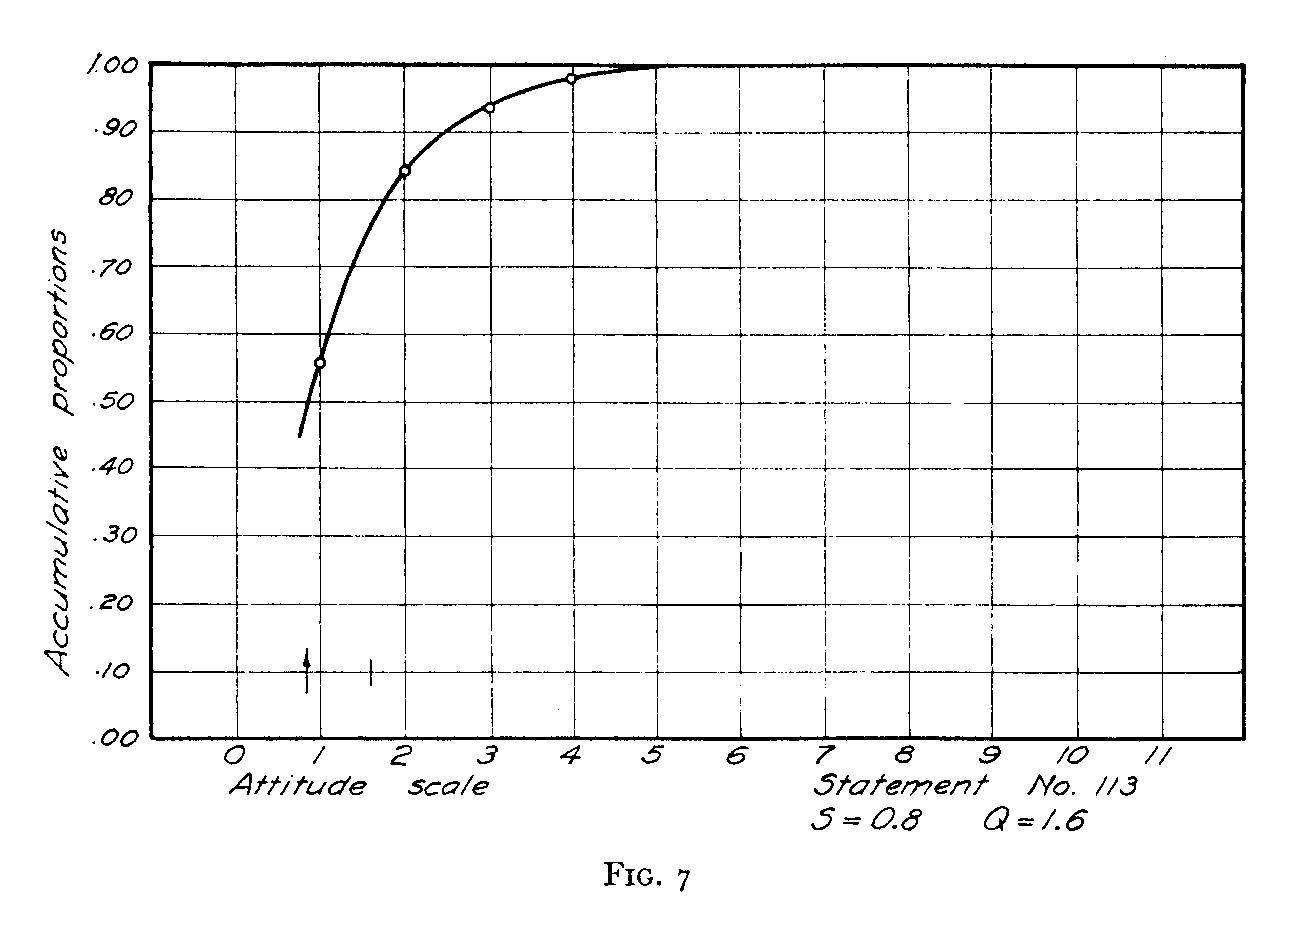
quartile distance is doubled since the lower quartile is indeterminate. The lower quartile point might be determined by additional extrapolation but that is probably less desirable than to double the upper quartile distance as an estimated Q-value.
In Figure 8 we have the graph for statement No. 48. It is clearly judged to be at the anti-end of the scale. Its scale value can be determined by extrapolation. The curve is continued until
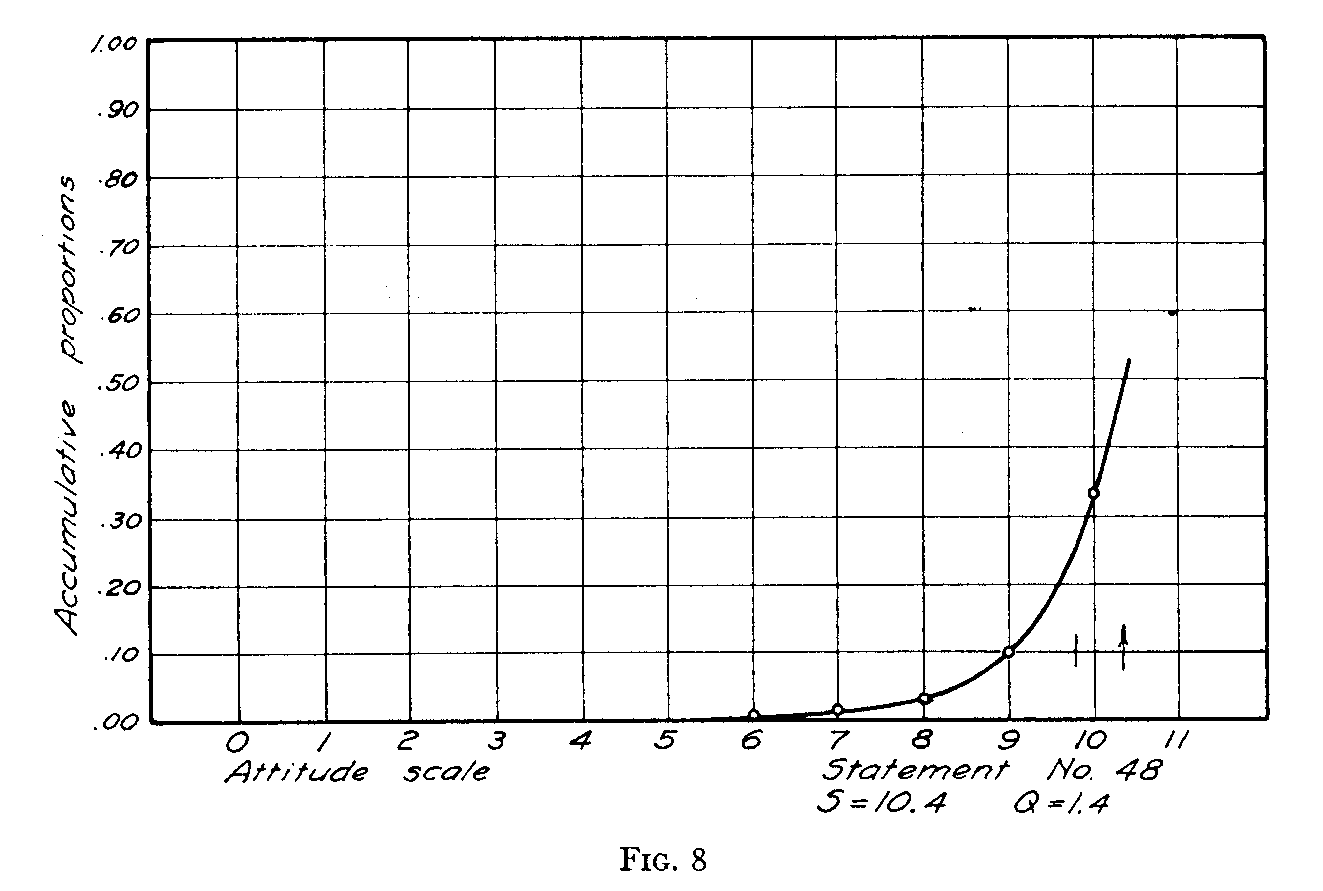
it crosses the 50 per cent level, which is at approximately 10.4, and this is assigned as the scale-value of the statement. The Q-value is ascertained by doubling the difference between the median point and the lower quartile point. It should be noted that the en-try of 1.00 in column K for statement 48 in Table I is ignored in drawing the curve of Figure 8. The entry in column K is always unity, and the ordinate at the point 11 is necessarily unity because all judgments which would place a statement beyond the point 11 are concentrated at the point 11. It does not represent the true ordinate at that point.
( 42)
RELIABILITY OF THE SCALE-VALUES
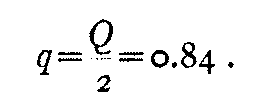
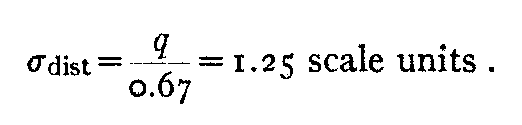
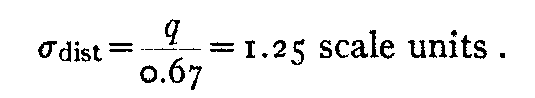
An approximate estimate of the reliability of the scale-values may be obtained in the following manner: The Q-value is twice the quartile deviation of the distribution of each opinion on the subjective scale.
Hence
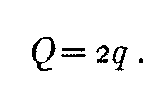
The average Q-value of the forty-five opinions in the experimental scale is 1.67 and consequently
The standard deviation of the distribution of scale-values is therefore, on the average,
The scale-value of an opinion is the median of its distribution on the subjective scale. Hence, the standard error of the scale value is
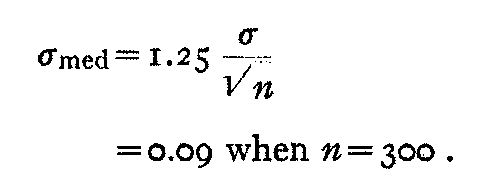
The probable error of the scale value is consequently
This is a very satisfactory reliability for the scale-values which are recorded to one decimal in our tables.
In order further to test the stability of the scale-values in a practical way we ascertained the changes in scale-values brought about by increasing the number of subjects from 150 to 300. In order to make such a test, we tabulated the results for the first 150
( 43) subjects who sorted the 130 statements into eleven piles, subjectively equally spaced. The sorting was continued until 300 subjects had done it. The scale-values were then determined for the entire group of 300. The discrepancies between the first set of
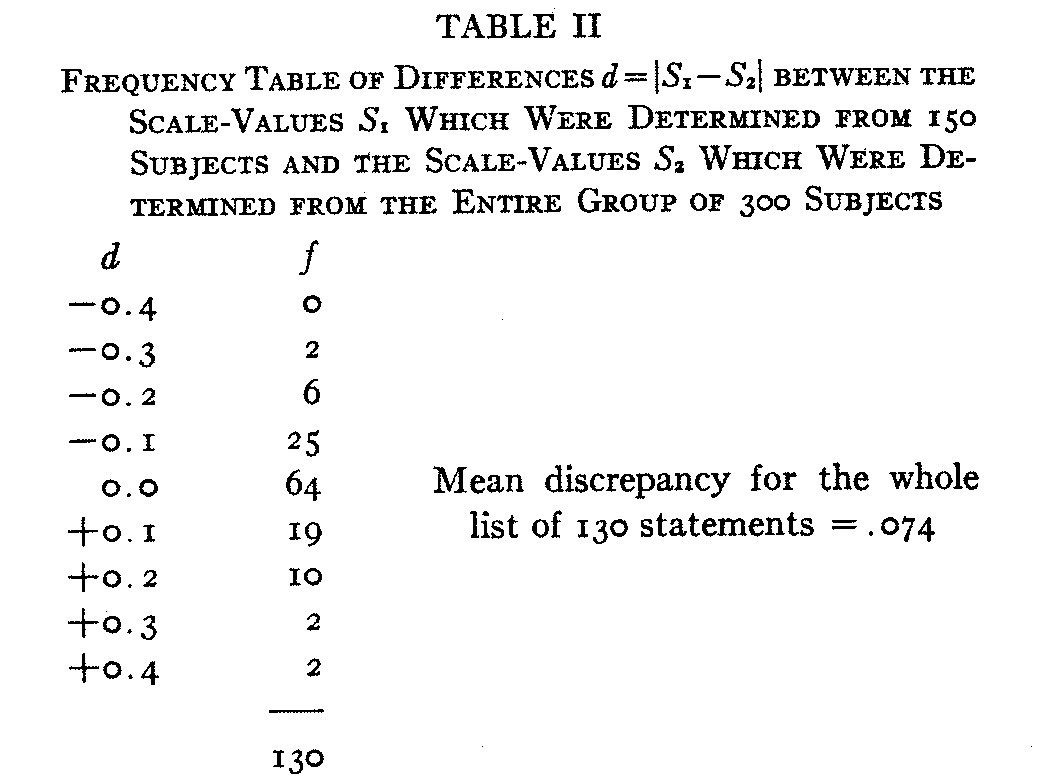
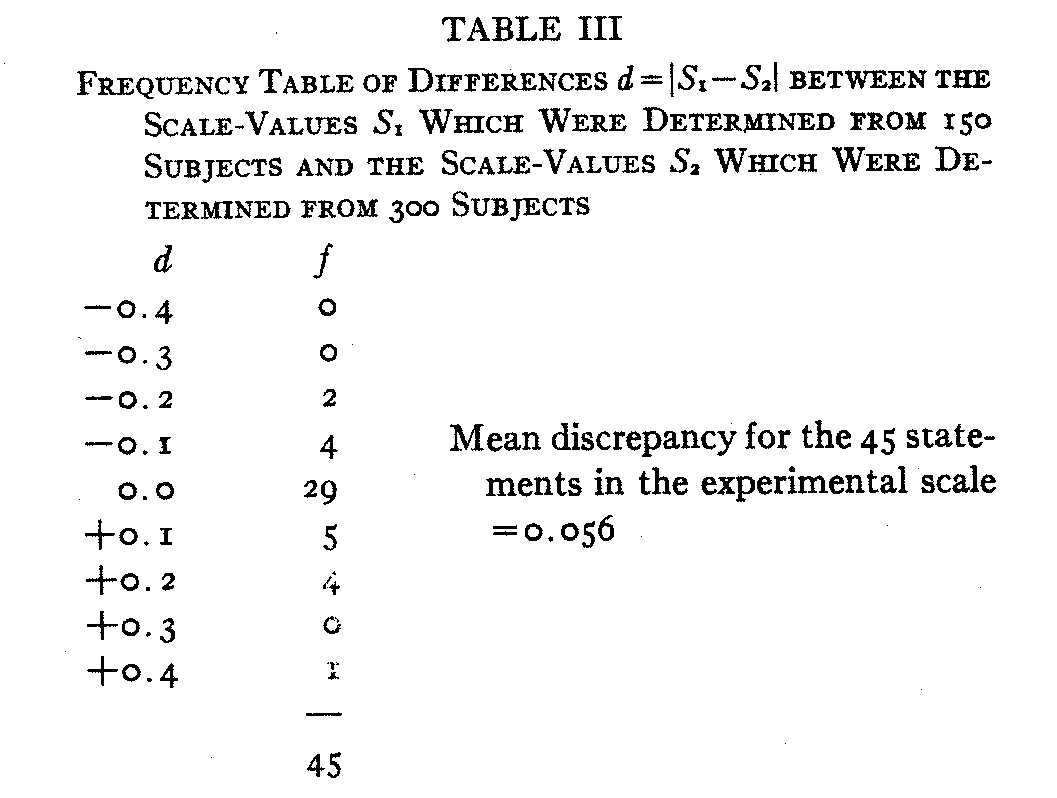
( 44) scale-values, determined by 150 subjects, and the final set of scale-values, determined by the entire group of 300 subjects, are summarized in Table II. The same kind of summary is shown in Table III for the discrepancies in the scale-values of the 45 statements chosen for the experimental scale. It is seen that the mean discrepancy between the scale-values from the data for 150 subjects and the scale-values from the 300 subjects is 0.074 scale-units for the entire set of 130 statements and 0.038 for the 45 statements in the experimental scale. These discrepancies are very small and they indicate that 300 subjects are quite sufficient to stabilize the scale-values for the method of equal-appearing intervals that we have used.
AN OBJECTIVE CRITERION OF AMBIGUITY
Inspection of the curves in Figures 2 to 8 inclusive reveals that some of the statements are more ambiguous than others. The degree of ambiguity in a statement is immediately apparent, and in fact it can be definitely measured. The steeper the curve, the smaller is the range of the scale over which it was classified by the readers and the clearer and more precise is the statement. The more gentle the slope of the curve, the more ambiguous is the statement. A simple method of measuring ambiguity is to deter-mine the scale-distance between the scale-value at which the curve of proportions has an ordinate of 0.25 and the scale-value at which the same curve has an ordinate of 0.75. This is merely the quartile distance.
The ambiguity, or Q-value, constitutes one of the objective criteria for eliminating unsuitable statements. Other things being equal, a statement with high Q-value should be eliminated from the scale. It has not been possible to select the statements for the final scale so as to satisfy completely all of the criteria simultaneously but the selection was made with the several criteria listed for each statement.
Since the Q-value is to be used for eliminating ambiguous
( 45) statements it becomes a matter of some importance to know if the average Q-value changes for different parts of the scale. In order to make this relation apparent we have plotted the average Q-value against scale-values in Figure g. This diagram simply means that all the statements with scale-values o — I have an average Q-value of 1.75, and similarly for the other points in the diagram. If all the statements throughout the whole range were
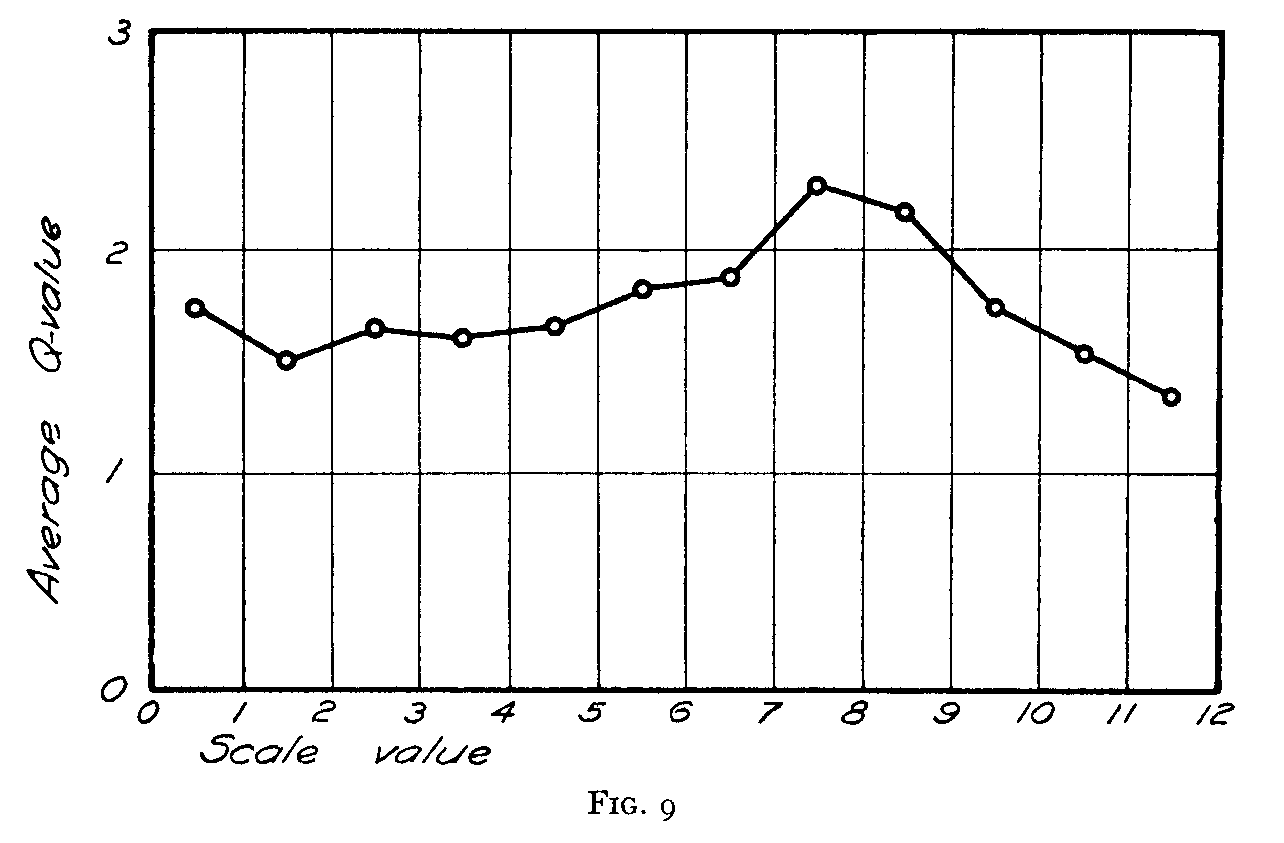
of the same average ambiguity, the line of this diagram would be horizontal and that would be the ideal condition for our present purposes. It does not show any gross variation in ambiguity al-though the statements which are in the vicinity of 7 or 8 on the scale have noticeably higher ambiguity than the other statements.
AN OBJECTIVE CRITERION OF IRRELEVANCE
We have tried to devise objective checks on our procedures wherever possible, and in the present experiments we have even retained intentionally a number of statements of opinion which were clearly ambiguous or otherwise unsuitable for an attitude
( 46) scale in order to see to what extent they could be eliminated by objective methods. We should hardly expect to be able to construct a workable attitude scale entirely by the mechanical application of objective rules. Some latitude will probably always be given to the judgment of the investigator, but our methods will be successful to the extent that the individual judgments of an investigator about material of this sort can be checked objectively. In the present study we retained some material which would have been eliminated by inspection at the very start just in order to test the validity of the several objective criteria.
The criterion of ambiguity is concerned with the spread of a statement over the subjective scale of equal-appearing intervals. If the 300 subjects place a statement of opinion in widely different intervals on the subjective scale, the Q-value of the statement will be large and the statement will therefore be judged by this objective criterion to be ambiguous. It has widely different meanings along the attitude scale when it is read by different subjects. Clearly such statements should be eliminated. Often it is possible to tell by inspection that a statement will have a large Q-value. It should be noted that the Q-value of a statement of opinion does not reflect the actual opinions held by the subjects on the issue in question. They sort the statements merely in accordance with the attitude that they read into the statements without thereby ex-pressing their own attitudes.
The criterion of irrelevance, on the other hand, is concerned with the records of actual votes. The whole list of 130 statements was mimeographed and presented to 300 subjects with the request that they check the statements that they indorsed or agreed with and that they leave blank the statements which they did not care to indorse. It was then possible to study the returns for internal consistency. If we find considerable inconsistency, we might at-tribute it to the carelessness of the subjects in making their check marks more or less at random, or we might attribute it to defects in the statements themselves. In the present experiments we
( 47) found a certain amount of inconsistency throughout the whole list, and it can undoubtedly be attributed at least in part to the subjects themselves. But the inconsistencies vary with the statement that is chosen as a basis of comparison with all the rest, and such differences are due primarily no doubt to defects in the statements themselves. We have so regarded them and we have devised a criterion of irrelevance which can be used further to eliminate the unsuitable statements from the scale.
This criterion is constructed as follows: Suppose that a statement of low ambiguity is properly scaled at the point 6. If a subject has an attitude which is also scaled properly at the point 6, then we should expect him to check that statement. Another subject who is scaled at the point i 2 should be less likely to check that statement, and similarly there should be a low probability that a subject at the point zero will check the statement at 6 on the scale.
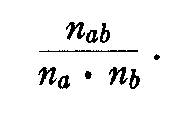
In order to make this type of analysis quantitative we have devised a rather crude index of similarity which is based on the voting of any large group of subjects. The index of similarity for any pair of statements is based on three facts, namely, na = the total number of subjects who indorse statement a in the comparison; nb = the total number of subjects who indorse statement b in the comparison; nab=the total number of subjects who indorse both a and b.
If the two statements a and b are practically identical in the attitudes they reflect, then we should expect to find that those subjects who indorse statement a will also indorse statement b. This factor, nab, will therefore be in the numerator of the index of similarity. On the other hand, the statements vary consider-ably in intrinsic popularity even when they are scaled at identical points on the scale. The more popular a statement is, the larger will be the number of people who indorse it and any other statement. In order to reduce the index of similarity to the same basis of popularity for all statements, the number of subjects who in-
( 48) -dorse both statements is divided by the product of the number of total indorsements for each of the two statements so that the index of similarity becomes
If we tabulate the indices for statement a with each of all the other
statements in turn, we shall have the common factor i/na which may be
disregarded since it is a constant. We shall then have
This index is written for the comparison of statement a with each of the others. It is evident that the maximum possible value for this index is unity and its minimum value is zero. If all of the people who indorse statement a also indorse statement k, then the index of similarity is unity as it should be because the two statements are then evidently very similar in the attitudes reflected. If, on the other hand, none of those who indorse statement a also indorse statement k, then the index is zero and this is reasonable because the two statements are then evidently very different in the attitudes which they describe.
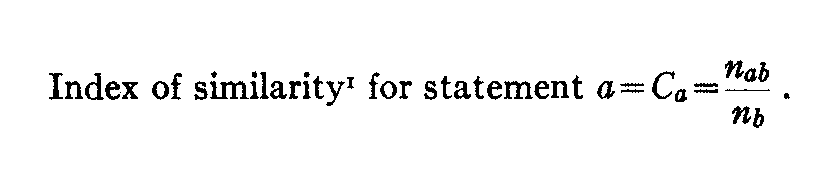
In Figure 10 we have a graphical representation of the indices of similarity for statement 96 with each of the other statements, plotted against the scale-value of each statement. The scale-value of statement 96 is indicated by the small arrow on the top line of the diagram. Its index of similarity with itself under ideal conditions would be unity. It is immediately apparent that the indices for statement 96 and each of the other statements are very low for those statements which are distant from statement 96. This is to be expected. In other words, those who indorsed statement 96,
<>
(49) which is scaled at 10.5, do not often indorse statements which are scaled in the four or five class-intervals at the other end of the scale. The indices are higher when the second statement approaches the scale-value of statement 96. Every small circle in this diagram represents the index of similarity between statement 96 and a second statement, and it is placed immediately above the scale-value of that second statement.
The criterion of irrelevance is the appearance of the whole diagram. If the indices of similarity are relatively high near the scale-value of the first or common statement and relatively low for statements that are distant from the first or common statement, then the first statement is considered to be satisfactory. It means merely that the people who indorse statement 96 are not so likely to indorse statements that are scaled distant from the scale-value of 96. The appearance of Figure 10 is considered to be satisfactory and therefore statement 96 is retained.
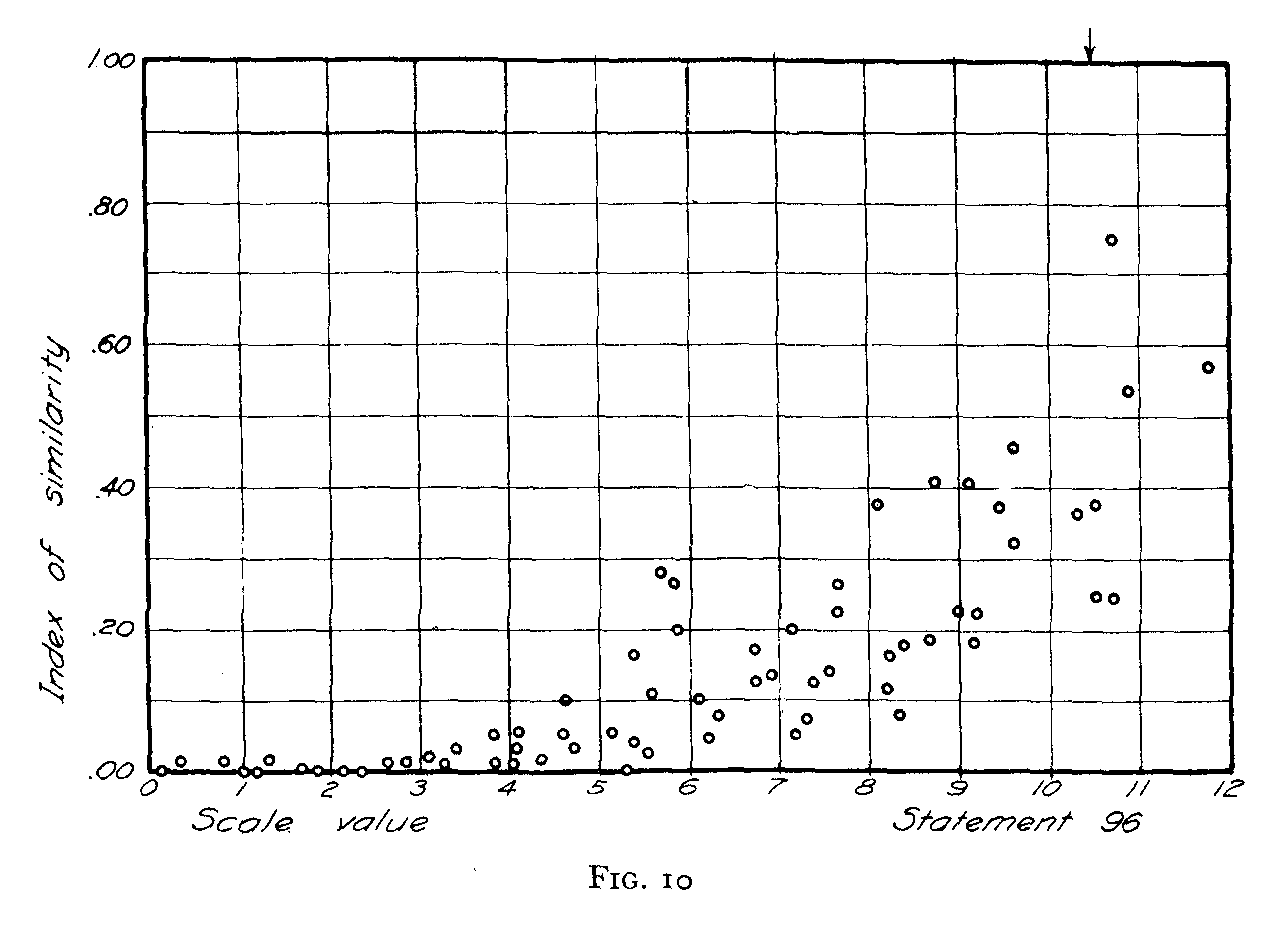
We may turn next to a similar analysis for a statement that
( 50) was discarded by the criterion of irrelevance. Figure 11 shows the indices of similarity for statement 23. The scale-value of this statement is also indicated by a small arrow on the top line of the diagram. Consider the small circle to the extreme left of this diagram. It is the index of similarity between statement 23 and statement 101, which has a scale-value of 0.02. The index is 0.56. The other circles are located in a similar manner and represent the degree of
similarity between statement 23 and each of the other statements.
Note that the people who indorse statement 23 are just as likely to indorse
statements at either extreme of the scale as the statements that are scaled near
to statement 23. The points scatter more or less horizontally on the diagram.
This indicates clearly that there is something fundamentally wrong with
statement 23 as an index of a particular attitude on the scale. In other words,
if a man indorses this statement we can say nothing about his attitude toward
the church because he is likely to indorse not only statements in the
class-interval 4�5 but also at either or both ex-
( 51) -tremes of the scale as far as one can judge by statement 23. The indorsement of this statement therefore does not help us in al-locating the subject to a point on the scale.
We then turn back to the original statement and we find that it reads as follows: "I am interested in a church that is beautiful and that emphasizes the aesthetic side of life." We can now see why this statement is irrelevant to the attitude variable that we are attempting to measure. The pious church-member can certainly indorse this statement conscientiously. Of course he is interested in a church that is beautiful. But the most outspoken atheist can also indorse the statement because he may very well be interested in beautiful buildings, including beautiful churches, and he may very well also be interested in church music even though he does not take at all seriously the religious functions of the church. The attitude reflected by the indorsement of statement 23 is therefore not valid as an index of the attitude variable which is implied in the list of statements as a whole. The fact that the indices of Figure 11 spread more or less horizontally across the whole scale constitutes the objective reason for discarding statement 23.
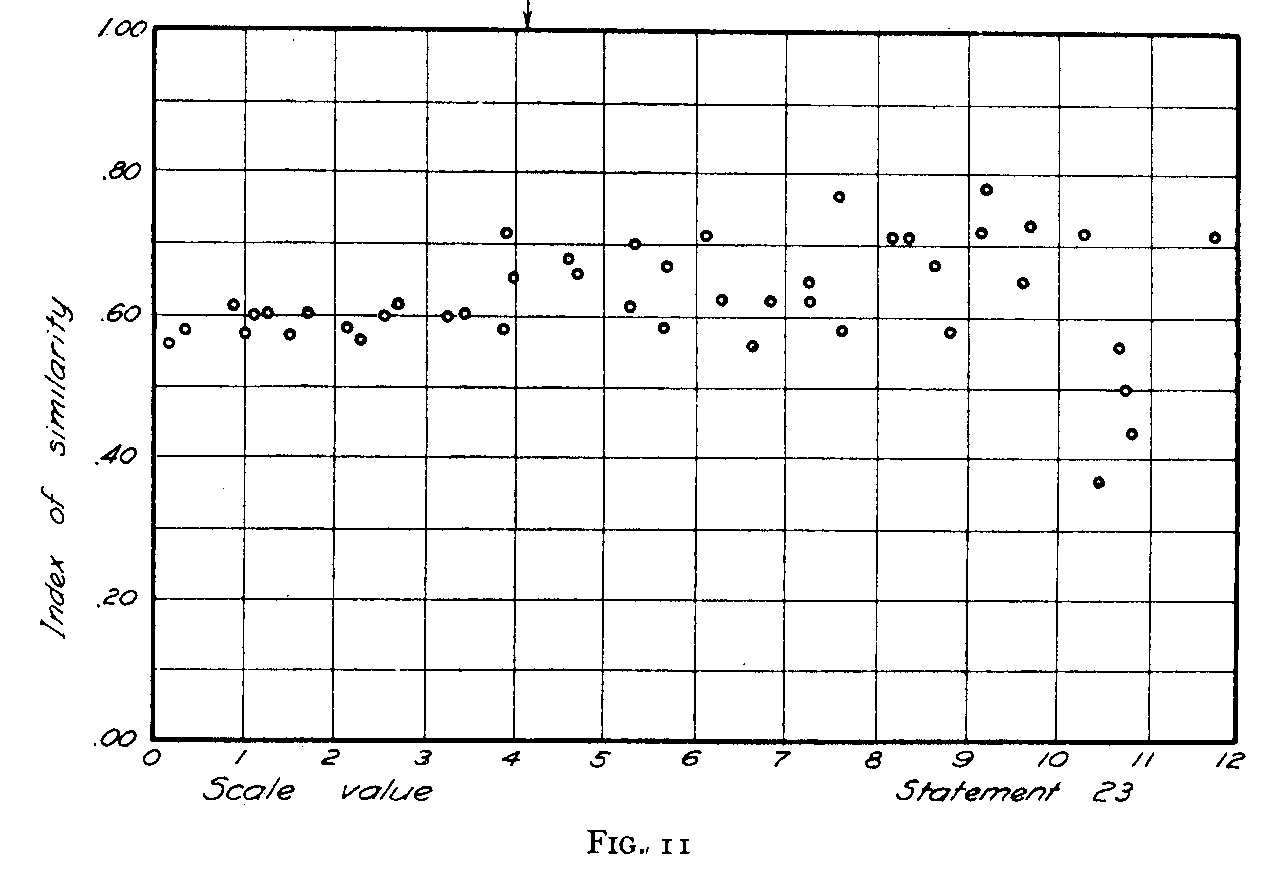
We may now review more briefly a few additional specimens showing the criterion of irrelevance for other statements. In Figure 12 the indices of similarity have been plotted for statement 7.This statement is scaled at 8.2 and the indices fall to very low values at the other end of the scale. This statement is therefore retained in the final scale.
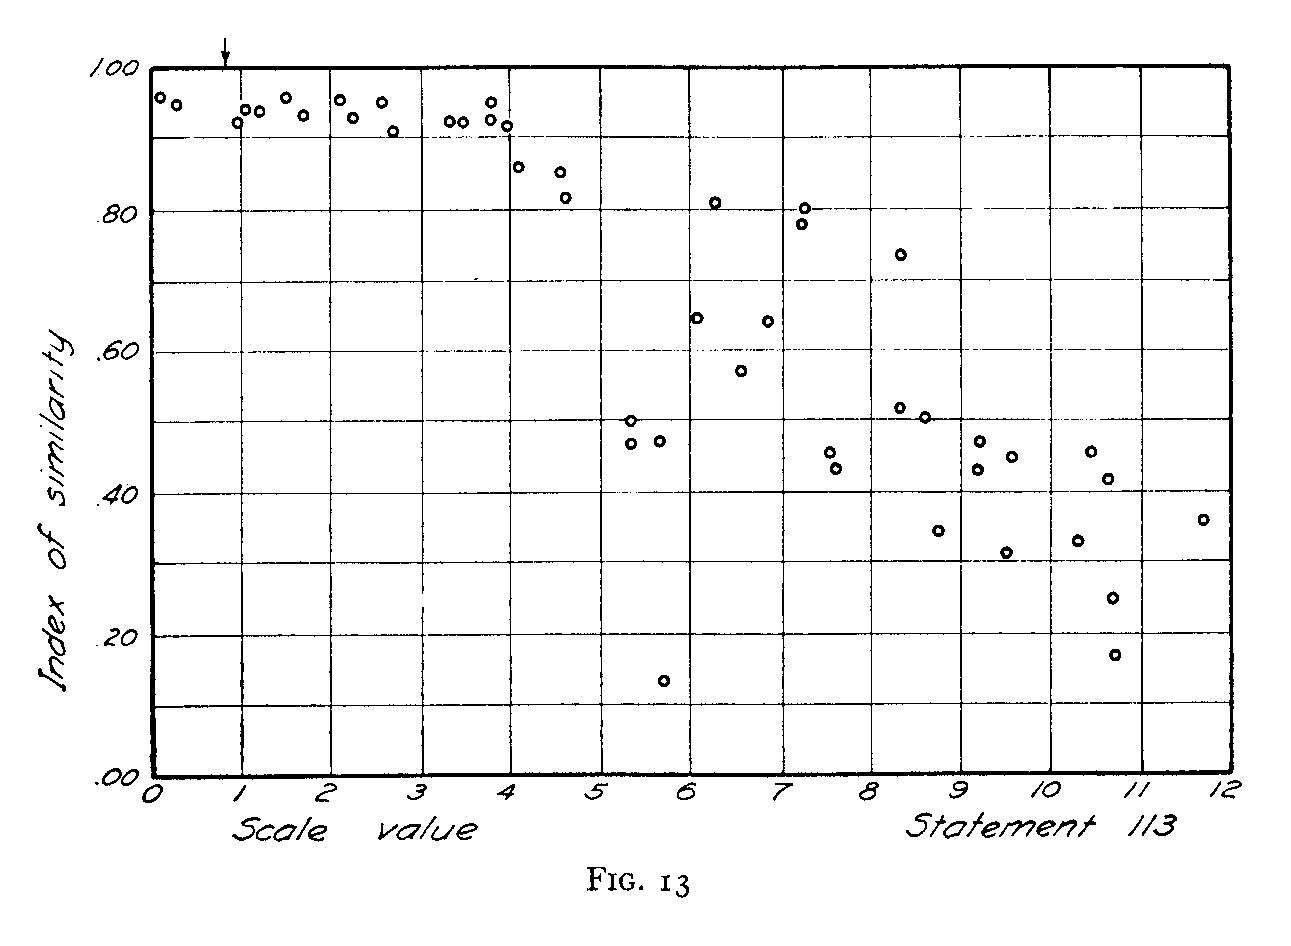
Figure 13 shows a similar plot for statement 113 in which the indices of similarity fall to rather low values for second statements in the upper half of the scale. The indices are all above 0.90 for the first few class-intervals. The statement is therefore retained for the final scale.
Figure 14 contains a similar plot for statement 49. Here again the indices spread more or less horizontally across the whole scale and therefore statement 49 is discarded. We turn to the original
( 52)
( 53) statement. It reads as follows: "I do not think one has to belong to the church to be religious." It is quite possible for a pious church-member to indorse this statement. It also is possible for the non-religious person to indorse it as a statement of fact even though he may have no interest in either the church or in religion. It is to be expected that the proportion of indorsements of this
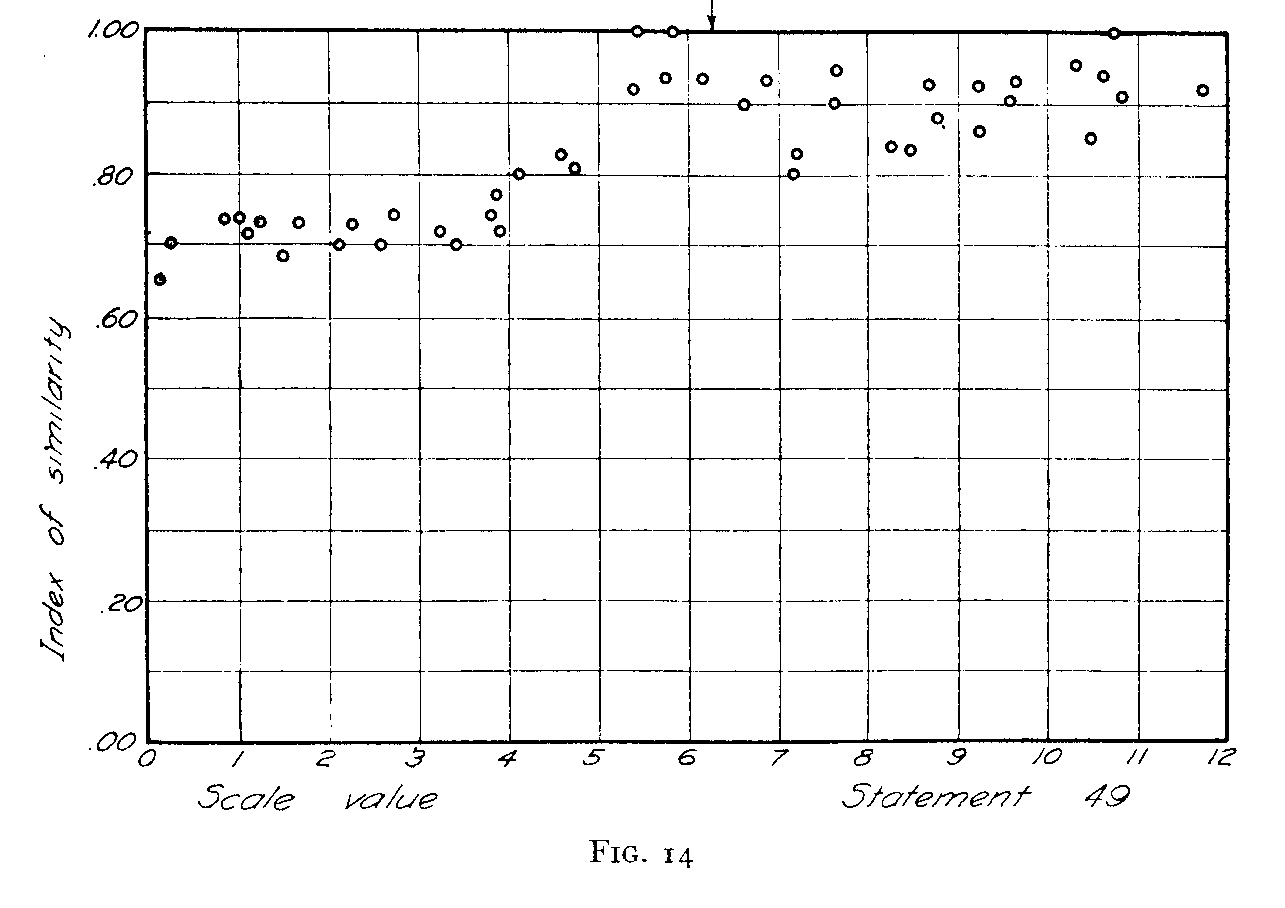
statement should be higher at the anti-end of the scale and this is what we find in Figure 14, but the discrimination is by no means sufficient. The indices have roughly the same level clear across the scale and the statement is therefore discarded.
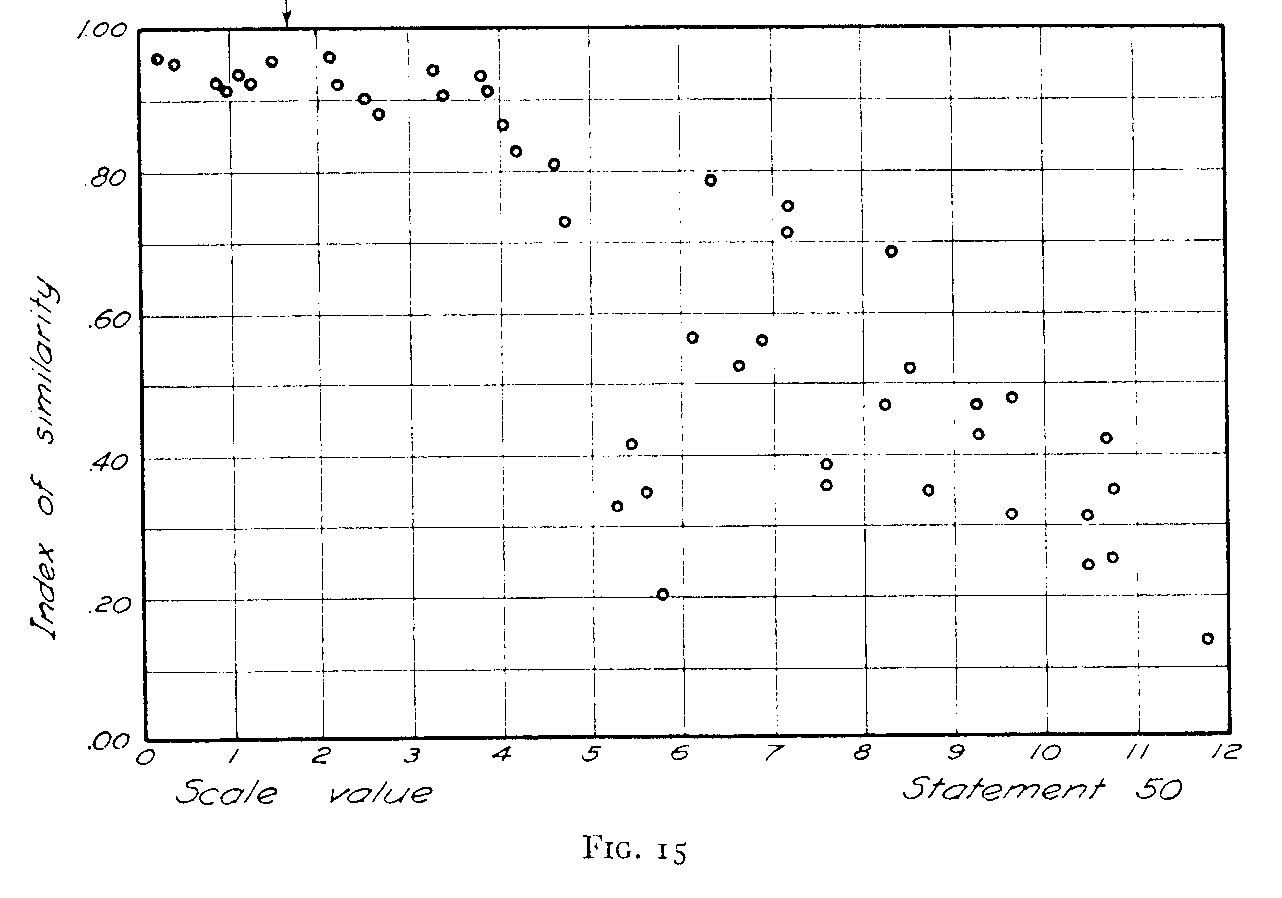
Figure 15 shows a satisfactory discrimination for statement 50 because the indices are above 0.90 in the vicinity of the scale-value of statement 50, indicated by the small arrow, and they fall to rather low values at the other end of the scale. The statement is therefore retained.
Figure 16 shows the plot for statement 9, which is discarded
( 54)
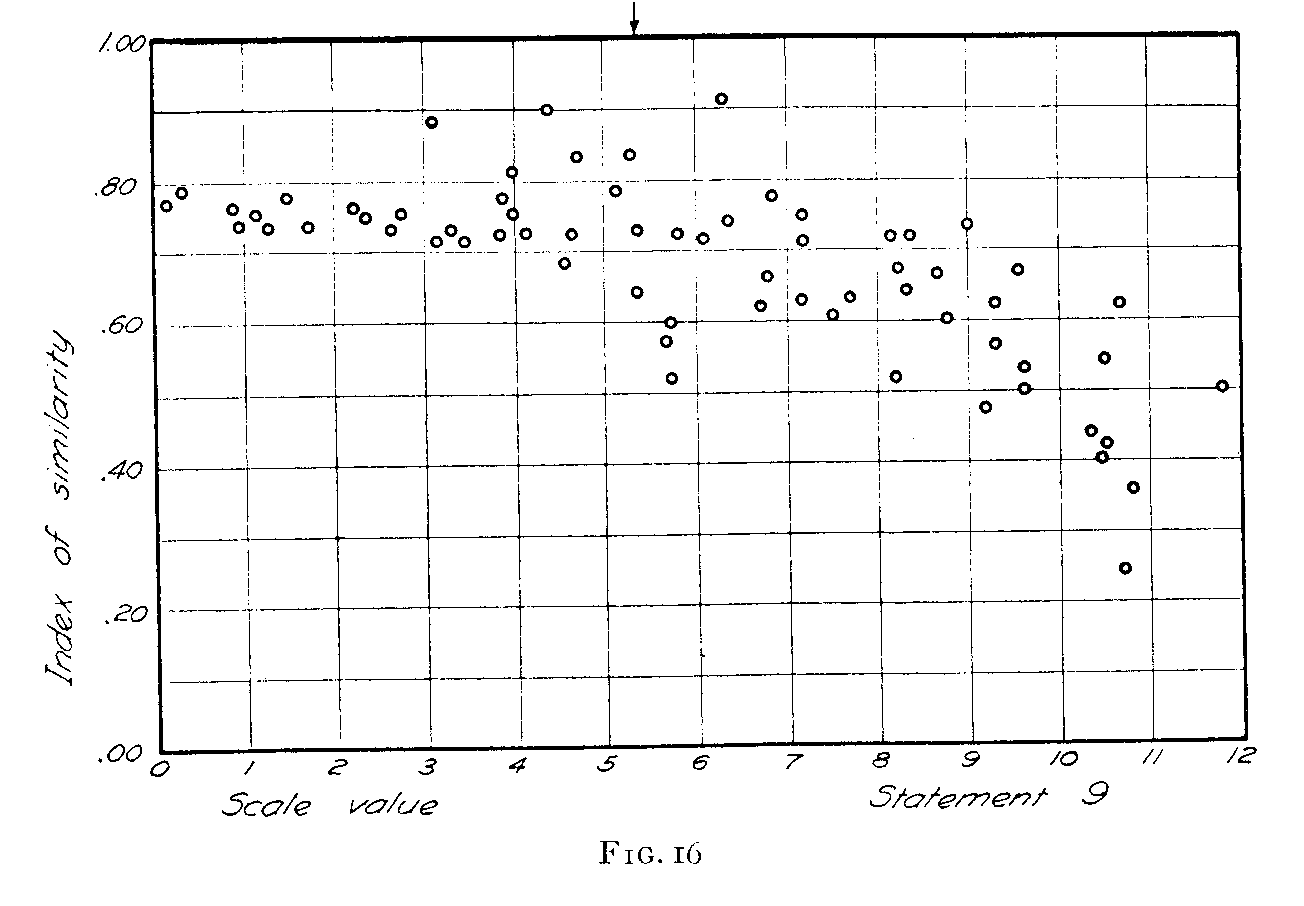
(55) because the indices of similarity do not show sufficient variation for the different parts of the scale. The statement actually reads: "I don't believe church-going will do anyone any harm." Here again we can readily imagine that the pious church-member will acknowledge the truth of the statement. The strong anti-church voter may also be willing to acknowledge that church-going will not do anyone any harm. The latter group do not so readily indorse the statement as the former, but inspection of the diagram indicates clearly that the discrimination is unsatisfactory. People all over the scale indorse this statement although they may have quite different feelings or ideas in doing so. The mere indorsement of this statement does not help us in locating the voter on the scale. The statement is therefore judged to be irrelevant to the scale, which is represented by the whole list of statements.
It would undoubtedly be possible to quantify the criterion of irrelevance still further. It seems better to delay further quantification until a more generalized rational formulation has been completed.
We have brought to bear on the selection and allocation of the statements of opinion two objective criteria, namely the criterion of ambiguity, the Q-value, which is based on the degree of uniformity in the sorting of the statements, and the criterion of irrelevance, which is based on the consistency of the actual voting, or indorsing. These two parts of our experiments were carried out on two different groups of subjects.
We have found that a statement may be sorted quite uniformly by all the subjects and still be declared unsuitable by the criterion of irrelevance. This may be explained as follows: When we read a statement and then judge the attitude which it would ordinarily represent, we may agree fairly well and thereby assign a low Q-value to the statement. When we are asked to indorse the statement, we may find that people of widely different attitudes find widely different reasons for indorsing it. This is especially likely to happen when a statement can be read either as an ex-
( 56) -pression of attitude or as an expression of fact. For example, the churchman is not likely to volunteer the statement, "Church-going will not do anyone any harm." A person who volunteers that statement spontaneously is not likely to be a devoted church-man. The situation is quite different when the statement is made by someone else and presented for indorsement as to whether it is true or false. In such a situation the churchman may acknowledge the statement to be true even though he would not naturally so express his own attitudes. This distinction between that which we say spontaneously in expressing our attitudes and that which we are willing to acknowledge or indorse when stated by someone else probably accounts for the fact that the criterion of ambiguity and the criterion of irrelevance do not always eliminate the same statements.
Ideally, the scale should perhaps be constructed by means of the voting only. It may be possible to formulate the problem so that the scale values of the statements may be extracted from the records of actual voting. If that should be possible, then the present procedure of establishing the scale-values by sorting will be superseded.
INFORMAL CRITERIA FOR THE SELECTION OF OPINIONS
As a result of our work on the present attitude scale we have formulated a list of informal criteria which will be used in the construction of future attitude scales. By these criteria it is seen that many of the opinions in the present experimental scale are defective, and it is our plan to start the construction of an improved attitude scale which shall be free as far as possible from the defects that we can now describe, but these criteria were not clearly formulated when the original material for the present experiments was compiled.
The following is a list of some informal criteria for the selection of opinions in the construction of an attitude scale. The list is cer-
( 57) -tainly not complete and it may very well be decided that some of the following characteristics are not defects.
1. As far as possible, the opinions should reflect the present attitude of the subject rather than his attitudes in the past. By wording the opinions in the present tense one avoids the situation in which a subject might indorse two conflicting opinions, one referring to his past attitude and one to his present attitude. The scale-value of the subject should naturally describe his present attitude.
2. It has been found that double-barreled statements tend to be ambiguous. The material should be edited so that each opinion expresses as far as possible only one thought or idea. The subject is confused in reading a double statement in which he might want to indorse one idea but not the other. Example: "I believe in the ideals of the church but I am tired of denominationalism." Perhaps this statement would serve better if it were divided into two opinions.
3. One should avoid statements which are evidently applicable to a very restricted range of indorsers. Example: "I go to church because I enjoy good music. I am in the choir and get musical training and chorus-singing." The first sentence can be indorsed by a fairly wide group of indorsers, but the second statement can be indorsed only by those who happen to be members of a church choir. It is probably not worth while to include opinions which are so restricted by factual qualifications in an attitude scale. What we want to measure is attitude and in doing so we should avoid so marked an influence on the range of possible indorsers. The foregoing statement would probably be much improved for our purposes if only the first sentence were retained for scaling.
4. Each opinion selected for the attitude scale should preferably be such that it is not possible for subjects from both ends of the scale to indorse it. Such opinions will be canceled by the objective criteria, but when this defect is conspicuous the state-
( 58) -ment might as well be discarded at the start. On the other hand, there will probably always he a certain number of opinions in a list which have this defect and which are not recognized when read by the investigator. Later, when they are discarded by the objective criteria it is usually easy to see why it is that these statements are eliminated. In other words, it is easier to have the objective basis for discarding a statement and then to see why it should have been discarded by inspection than to spot these defective statements in the reading of the original whole list of statements.
5. As far as possible the statements should be free from related and confusing concepts. In the present material we have a number of statements which mention "true religion" and "the religion of Jesus." These statements are likely to be difficult to interpret because, in addition to the assertions about the church, these statements involve also additional though related concepts which might as well be avoided wherever possible. Example: "I think the church allows denominational differences to appear larger than true religion." A statement of this type can just as well be written directly with reference to the alleged overemphasis of denominational differences by the churches without involving the uncertainties of interpretation of the phrase, "true religion."
6. Other things being equal, slang may be avoided except where it serves the purpose of describing an attitude more briefly than it could otherwise be stated. For example, to say that most sermons are "all bunk" may be justified if it should be considered a natural way of expressing an attitude which is to be represented on the scale.